

Gasoline is up 34% and airfare 22%, but eggs are down 21%: where inflation is and isn't
Overall prices rose 3.7% in the year to September. Behind that single number, ten categories are running hotter and six are actually falling. Here is the full map from the Bureau of Labor Statistics data.
Headline inflation was 3.7% in the 12 months to September, according to the Bureau of Labor Statistics. That average hides a huge spread. Gasoline is up 34.2% from a year ago. Eggs are down 20.6%. We took 28 CPI categories, ranked them against the 3.7% overall rate, and put the result in one chart. Our inflation page carries the full table.
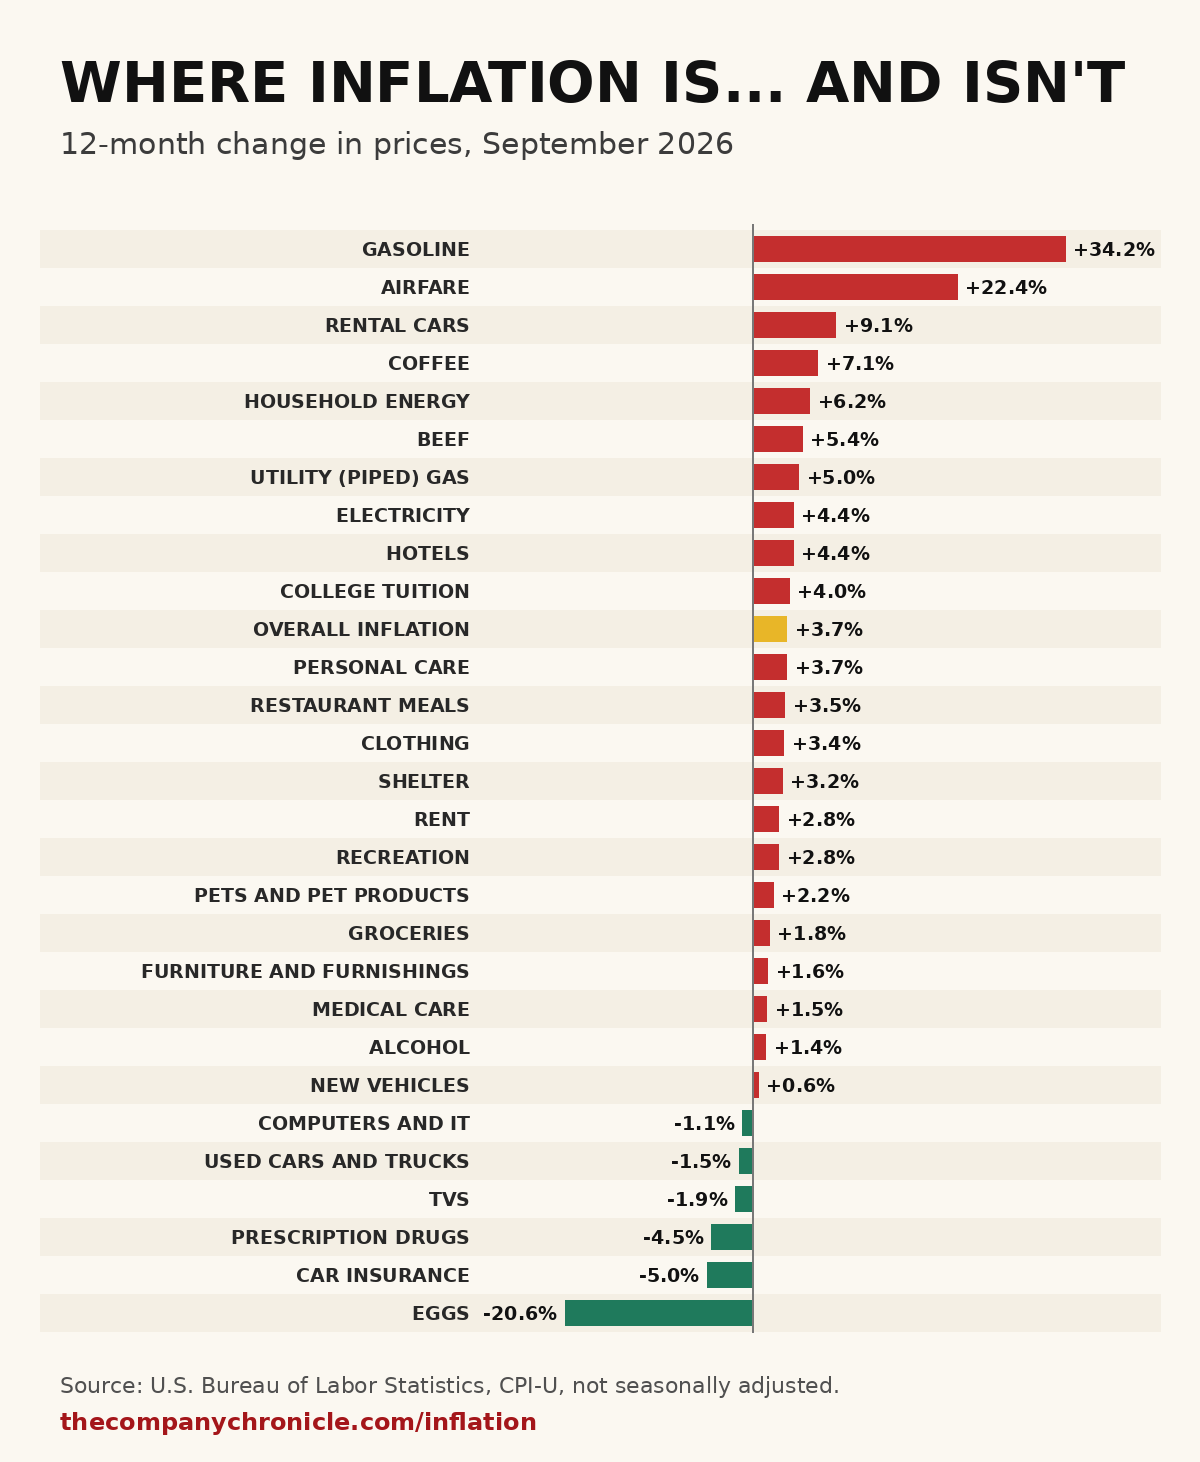
Open the full chart: where inflation is and isn't, September 2026
The biggest risers
| Category | 12-month change | Versus overall (3.7%) |
|---|---|---|
| Gasoline | +34.2% | about 9 times as fast |
| Airfare | +22.4% | about 6 times as fast |
| Rental cars | +9.1% | +5.4 points |
| Coffee | +7.1% | +3.4 points |
| Household energy | +6.2% | +2.5 points |
| Beef | +5.4% | +1.7 points |
Gasoline alone is the story. A 34.2% jump in pump prices is roughly 30 points above the overall rate, and energy costs carry into airfare, rental cars and delivery. Utility (piped) gas is up 5.0% and electricity 4.4%, so the energy squeeze is also showing up in monthly utility bills. Hotels (+4.4%) and college tuition (+4.0%) round out the ten categories running above the overall rate. Personal care matches it at 3.7%.
The biggest fallers
| Category | 12-month change |
|---|---|
| Eggs | -20.6% |
| Car insurance | -5.0% |
| Prescription drugs | -4.5% |
| TVs | -1.9% |
| Used cars and trucks | -1.5% |
| Computers and IT | -1.1% |
Six of the 28 categories are cheaper than a year ago. New vehicles are barely moving at +0.6%. Medical care (+1.5%), groceries (+1.8%) and furniture and furnishings (+1.6%) are also well under the headline rate.
Where inflation is not
Housing is a quieter story than the headline implies: shelter is up 3.2% and rent 2.8%, both below overall inflation. Groceries at +1.8% are running at about half the overall rate, while restaurant meals are up 3.5%. That gap matters to anyone who buys food for a living or sells it: the cost of cooking at home is rising much more slowly than the price of eating out.
What it means
For a restaurant owner, the picture is mixed: beef (+5.4%) and coffee (+7.1%) are the pressure points on the menu, while eggs (-20.6%) are a real offset. For anyone who drives for a living, the fuel line is the budget: a delivery van or a contractor's truck pays 34.2% more per gallon than a year ago. For a business that sends staff on the road, airfare (+22.4%) and rental cars (+9.1%) are the lines to renegotiate or cut.
The wider point is that a 3.7% average is being pulled up by energy and travel, not by a broad surge in everyday prices. Stripping those out leaves many categories at or below 3%. We covered the headline numbers in our September CPI report, and the chart will be updated on /inflation when the next report arrives.
Sources: U.S. Bureau of Labor Statistics, Consumer Price Index for All Urban Consumers (CPI-U), 12-month percent change, not seasonally adjusted, September 2026. We re-checked the gasoline, airfare, eggs, prescription drugs, car insurance, groceries and overall index values against the BLS API on October 26, 2026. The "times as fast" and "points" comparisons are our calculations from the published rates. Economic information, not financial advice.
Want your business to be the answer?
Get a full package of articles about your business, built so customers, Google and AI assistants can find you.
 New ebook from The Company ChronicleHow to Research Like a Wall Street AnalystFind original sources, analyze trends, and build your own insights. 36 pages with worksheets.Get the ebook · $29Instant PDF download