

What September's higher spending actually means for a restaurant, a salon and a store
Consumer spending rose 0.5% nationally, but inflation-adjusted spending barely moved and real disposable income fell. Higher sales dollars alone cannot tell an owner whether demand improved.
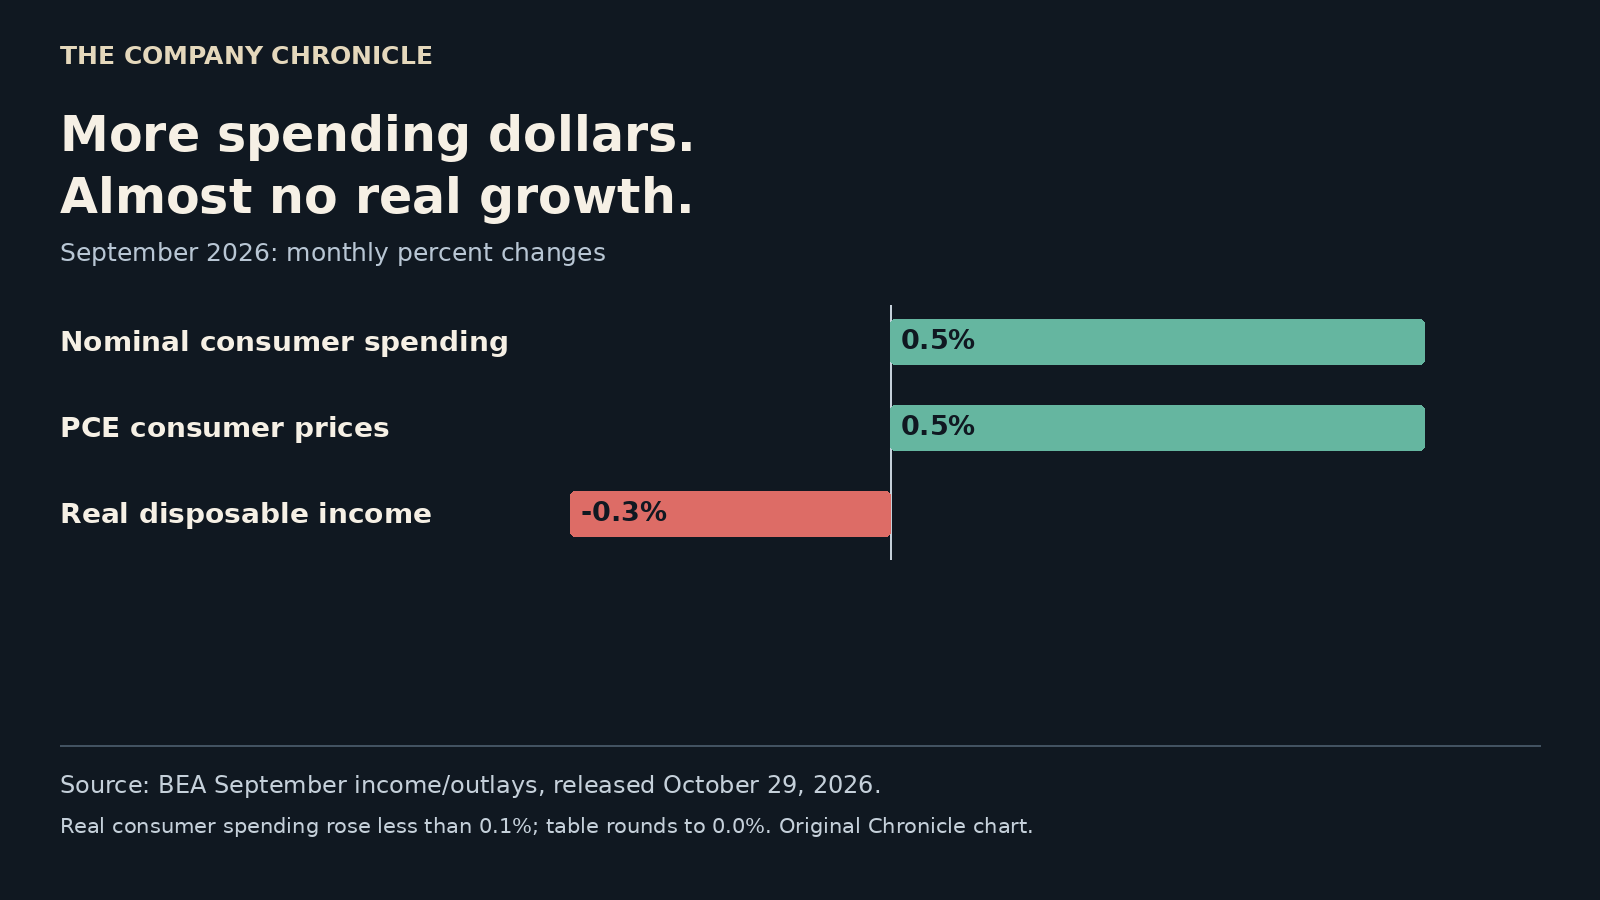
American consumers spent 0.5% more in September, but that did not mean they purchased 0.5% more goods and services. Prices rose 0.5% in the same month, leaving inflation-adjusted spending up less than 0.1%, according to the Bureau of Economic Analysis release published Thursday.
For a restaurant, salon or independent retailer, that distinction is the practical finding. A larger dollar total at the register can reflect higher prices rather than more meals, appointments or items sold. The national report does not measure any individual shop, but it shows why an owner's sales dashboard needs a volume check beside the revenue line.
The customer budget underneath the receipts
The September income and outlays release put nominal spending up $113.1 billion and disposable income up $52.7 billion, or 0.2%. After inflation, disposable income fell 0.3%. The personal saving rate was 3.8%.
That combination describes consumers spending more dollars without a comparable gain in purchasing power. It does not prove that a particular household borrowed more, and the aggregate saving rate cannot tell an owner how much cash a particular customer has available.
| September measure | Monthly change |
|---|---|
| Current-dollar consumer spending | +0.5% |
| Consumer prices, PCE index | +0.5% |
| Real consumer spending | Less than +0.1% |
| Real disposable personal income | -0.3% |
A $100,000 sales example
Consider an illustrative business whose sales increase from $100,000 to $100,500, while the prices it charges rise by exactly 0.5%. Dividing $100,500 by 1.005 gives $100,000. In that simplified example, sales at unchanged prices have not increased at all. This is arithmetic, not an estimate of what happened to any surveyed business.
A business cannot use the national PCE index as an exact deflator for its own revenue. Its product mix and prices differ from the consumer basket. The useful step is to reproduce that calculation with its own price changes, transaction counts and units, then separate price from volume before committing to extra fixed costs.
Three different operating decisions
A restaurant: compare checks served with the average check. If the check count is flat and menu changes explain the extra dollars, those dollars do not establish a need for more seats or another recurring shift. Ingredient and labor costs still have to be checked separately; the PCE report supplies no restaurant-specific margin estimate.
A salon: compare completed appointments with average revenue per appointment. A price rise can lift receipts while the appointment book remains unchanged. Before extending opening hours, compare actual bookings and cancellations with the added staffing cost rather than extrapolating from nominal revenue alone.
A retailer: compare units, transactions and average basket value. More dollars accompanied by fewer items is different from more units moving off the shelf. A reorder based on the dollar figure alone can mistake price inflation for faster inventory turnover.
The inflation number is still moving
September's PCE price index was 3.6% above a year earlier. The measure excluding food and energy rose 3.1% yearly and 0.3% monthly. Those are different comparisons: the monthly headline increase was 0.5%, not 3.6%. Treating an annual inflation rate as one month's price change would badly distort a cash forecast.
The immediate business response is measurement, not an automatic price increase or a hiring freeze. Keep the revenue gain, count the units behind it and price the next commitment against that evidence. The next BEA installment is scheduled for November 25; a September national spending report is useful context, not a substitute for October's own customer records.
Source: BEA, Personal Income and Outlays, September 2026, released October 29. The sales illustration is The Company Chronicle's calculation using explicitly hypothetical inputs. This is business information, not investment advice.
Want your business to be the answer?
Get a full package of articles about your business, built so customers, Google and AI assistants can find you.
 New ebook from The Company ChronicleHow to Research Like a Wall Street AnalystFind original sources, analyze trends, and build your own insights. 36 pages with worksheets.Get the ebook · $29Instant PDF download