

Nasdaq falls 1.4% as Alphabet slumps 12.6%, despite faster GDP growth
The Nasdaq lost 365 points while the S&P 500 slipped 0.3%. Separate economic releases showed stronger output and persistent inflation.
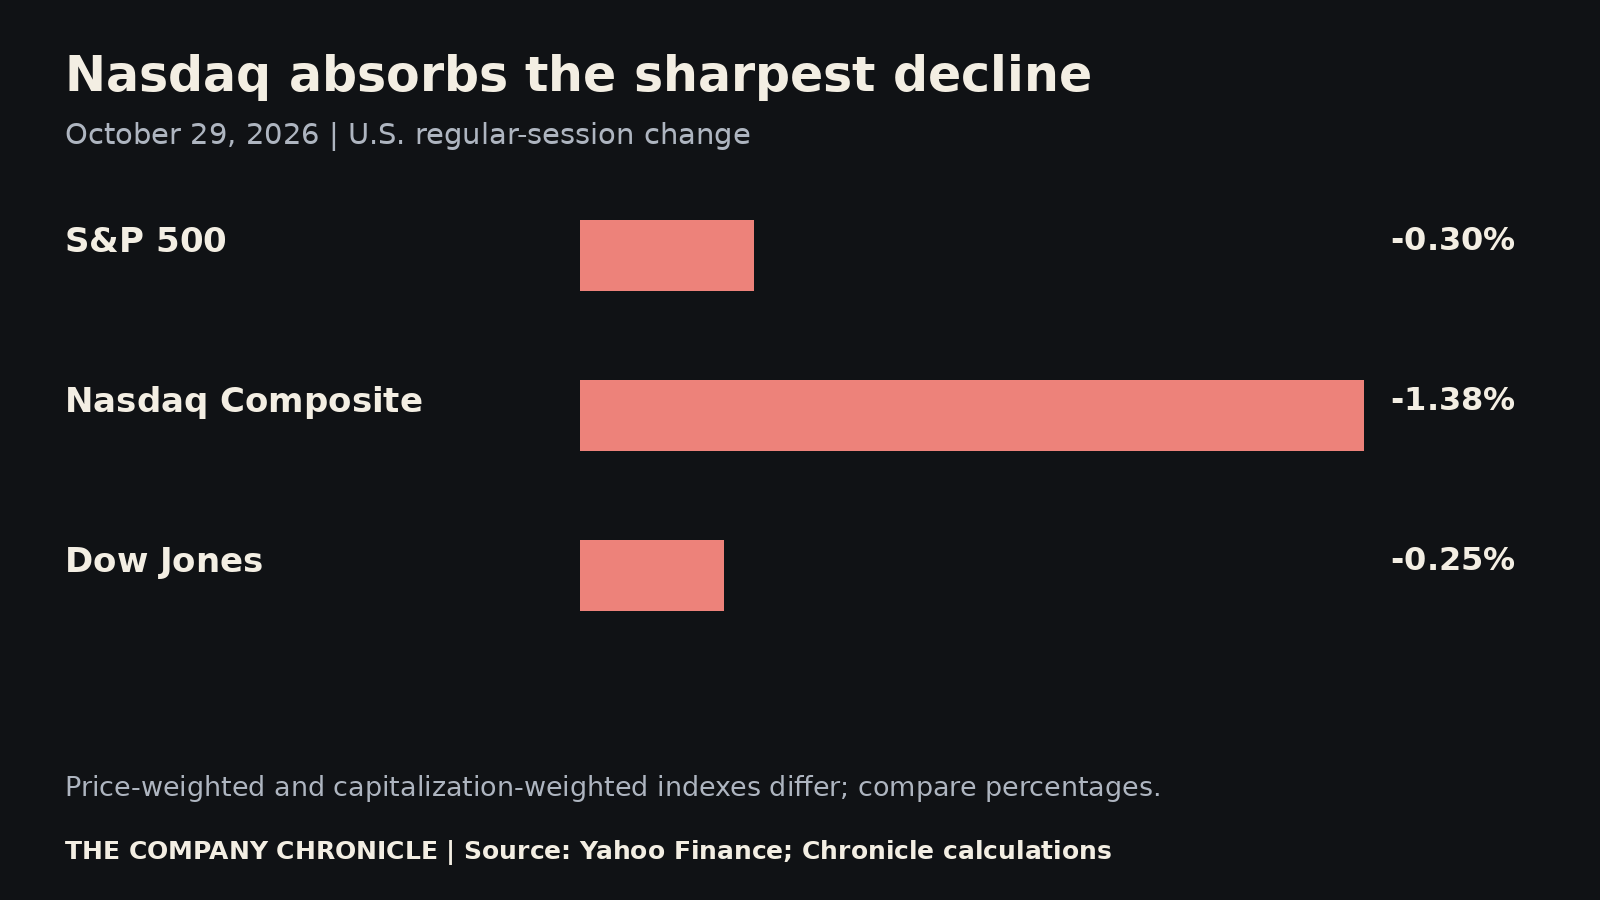
The Nasdaq Composite fell 1.38% to 26,184.72 on Thursday, October 29, as Alphabet's Class A shares dropped 12.64% following its results. The S&P 500 declined 0.30% to 7,720.39 and the Dow Jones Industrial Average slipped 0.25% to 52,342.56, according to Yahoo Finance's regular-session market data.
It was a sharper setback for the technology-heavy Nasdaq than for either of the other two benchmarks. The figures here are the completed U.S. cash session, not futures or after-hours quotes. They were checked after the close; later trading can differ.
A smaller headline decline concealed a larger technology move
| Index | October 29 close | Points | Day change |
|---|---|---|---|
| S&P 500 | 7,720.39 | -23.59 | -0.30% |
| Nasdaq Composite | 26,184.72 | -365.13 | -1.38% |
| Dow Jones Industrial Average | 52,342.56 | -132.54 | -0.25% |
The Nasdaq's 365.13-point decline compared with a 23.59-point loss for the S&P 500 and a 132.54-point loss for the Dow. Point changes cannot be compared directly across indexes with different levels. On a percentage basis, the Nasdaq's decline was roughly four and a half times the S&P's.
Alphabet's Class A shares finished at $283.82, down from $324.89 a day earlier. Microsoft finished at $530.14, a 0.16% decline. Those two outcomes illustrate why a broad phrase such as “technology earnings” does not describe every company's reaction. A large individual-stock move also does not establish how every other constituent traded.
The benchmark figures do not supply market breadth. They cannot, on their own, show whether a majority of stocks rose or fell. Nor does a stock-price reaction prove which line of an earnings release investors cared about most. Readers assessing company spending should compare the underlying cash-flow tables rather than infer the whole story from the closing price.
The economy's growth number was stronger than the market's day
The Bureau of Economic Analysis's advance GDP estimate put third-quarter real growth at a 3.4% annualized rate, following 2.2% in the second quarter. That is an estimate of inflation-adjusted output during July through September. It is not a measurement of Thursday's business conditions, and an advance estimate can be revised.
A separate BEA income and spending release showed September PCE inflation at 3.6% from a year earlier, with the measure excluding food and energy at 3.1%. Stronger output and persistent inflation can coexist. Neither release establishes the Federal Reserve's next decision.
Keep the clocks separate
For a business owner or borrower, the practical distinction is between share prices, economic activity and financing costs. A one-day equity decline is not itself a change to a credit-line payment. A contract's benchmark rate and reset date determine that payment. For an investor checking the day's move, regular-session closes should be compared with regular-session closes, while earnings released after the bell belong to a separate trading window.
Sources: Yahoo Finance regular-session data for October 29 and October 28; Bureau of Economic Analysis GDP and personal income releases dated October 29. Changes and chart calculated by The Company Chronicle. Some market data may be delayed. This is market information, not investment advice.
Want your business to be the answer?
Get a full package of articles about your business, built so customers, Google and AI assistants can find you.
 New ebook from The Company ChronicleHow to Research Like a Wall Street AnalystFind original sources, analyze trends, and build your own insights. 36 pages with worksheets.Get the ebook · $29Instant PDF download